Dashboard - Plots
The plots tab of your SpaceFarmer dashboard helps you monitor your system. Especially when your farm grows large in size, this tab may be of great value to you. There is also an option to name your harvesters, so you can identify them more easily.
In this tab, you will find information regarding
- points and size estimates at the harvester level
- points and size estimates at the plot level
Zooming in at this low granularity may help to identify problems that remain unobserved at the general farm level.
When you do encounter problems, see the debug log or find our experts in the SpaceFarmers discord server.
Why are my plots not visible over the last x days?
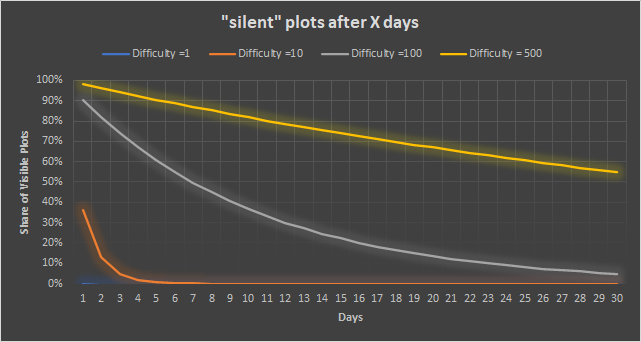
Farmers that use a high difficulty level, may find that some of their plots won't show up in the plot tab. We call these “silent plots”.
Example: for the 7 day period, a difficulty of 10 = 0,1% silent plots, difficulty 100 = 50% silent plots, difficulty 500 = 87% silent plots. For a 30 day period, difficulty 10 = 0%, difficulty 100 = 5%, and difficulty 500 = 55% silent plots.
So keep in mind that when you have a high difficulty, there is no need to delete the plots that don't show up in the plots tab!

